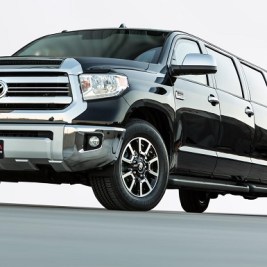
 What state is most expensive for car ownership?
Most people would think of somewhere such as New York, New Jersey, California or Massachusetts.
Very few would think of Wyoming, which, in fact, is the most expensive state for car ownership, when repairs, insurance and gasoline are combined, according to a car-cost study by Bankrate.com.
The big difference in Wyoming is the cost of fueling a vehicle in a state with lots of space between stops.
“Although it has below-average repair, fuel and insurance costs, Wyoming marked the list as the most expensive state … [because] everything is so far apart,” reported Auto Remarketing online. “Wyoming residents drive 68 percent more than the national average, spending $1,588 per year on gas.”
The average annual cost of driving a vehicle in Wyoming is $2,705, about 6 percent higher than the next expensive state, Louisiana, at $2,555, according to the Bankrate study, and more than 39 percent higher than the least-expensive state, Iowa, at $1,942. Iowa’s low operating costs were driven by the U.S.-lowest insurance expense of $630 per year, Bankrate showed.
Other top 10 most-expensive states, in order, are Florida, Mississippi, New Jersey, Georgia, Delaware, Alabama, Michigan and Connecticut, with average costs ranging from $2,516 to $2,372.
Least-expensive states ranking after Iowa are Ohio, Illinois, Idaho, Wisconsin, South Dakota, Pennsylvania, New Hampshire, Nebraska and Oregon, with costs from $1,973 to $2,081.
“The Midwest has one quality that Americans are sure to love,” said Bankrate. “It’s home to some of the cheapest states for drivers. Several Midwestern states ranked among the cheapest in the country.”
And what about the states that we expected to see on the most-expensive list – other than New Jersey, which indeed was among the most expensive? Massachusetts, New York and California all were solidly middling on average, with annual car ownership costs at $2,169, $2,273 and $2,237, respectively.
For a full listing of states and vehicle expenses see the Bankrate.com article. There, you also can see for yourself which states were most and least expensive in each of the three measured categories.
Bankrate analyzed the cost of car ownership in all 50 states and the District of Columbia. Labor and parts data were provided by CarMD.com, while gas spending was calculated with statistics from GasBuddy.com and the Bureau of Transportation Statistics. Insurance costs were compiled from National Association of Insurance Commissioners statistics.
Visit the Santander Consumer USA blog regularly for more news on auto-, auto-finance and SCUSA-related topics.


